
Ontario: The Geology of Rising Land - Isostatic Rebound
The land in central and northern Ontario is rising. In fact, the land across much of Canada is rising!
In northern Ontario, along the shores of Hudson Bay and James Bay, the land is rising really quickly. The land between Fort Severn, Peawanuck, and Cape Henrietta Maria is rising faster than any other area land in Ontario (Figure 1 - red and pinky white area). That land along the southern coast of Hudson Bay coast is rising at about 1 to 1.3 meters (3.4 to 4.3 feet) per hundred years. Farther south along James Bay, towards Moosonee, and into southern Ontario, the land is still rising, but less dramatically.
What on Earth is happening with the Ontario beneath our feet? Why is the land rising? The answer lies in the last great Ice Age.
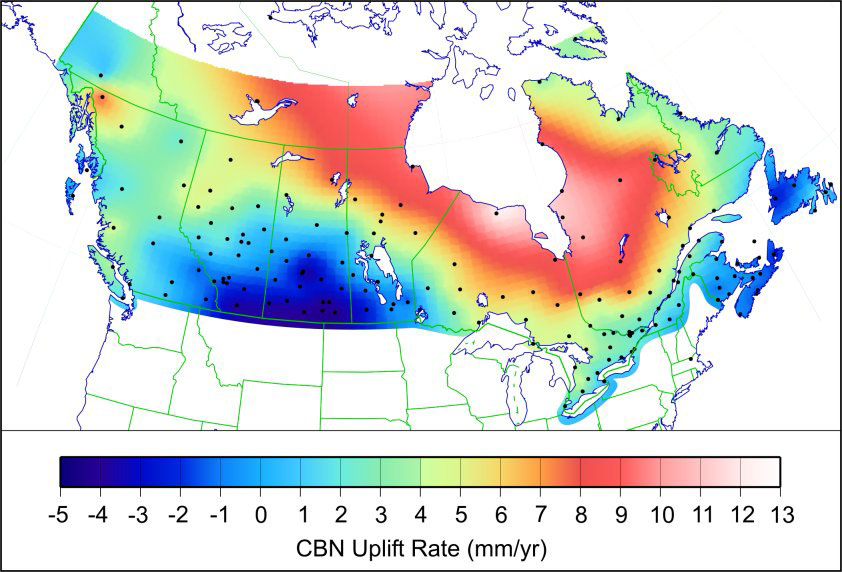
Figure 1: This image shows the rate at which the land is rising in response to isostatic adjustment. The red to pinky-white coloured areas along the southern coast of Hudson Bay is the fastest rising area in Ontario at about 13 milimeters per year, or about 1.3 meters per hundred years. Image from: Crustal motion and deformation monitoring of the Canadian landmass
Last Ice Age
The story of rising land begins with the last ice age. Let us imagine the northern part of the Earth over the past 2.5 million years. During this time, almost all of Canada, Antarctica, and the northern parts of United States, Europe and Asia, were covered by a great ice sheets (Figure 2). In places, those ice sheets were were up to 3 kilometers thick. Geologists call this time of Earth history the Pleistocene epoch - the last great ice age.
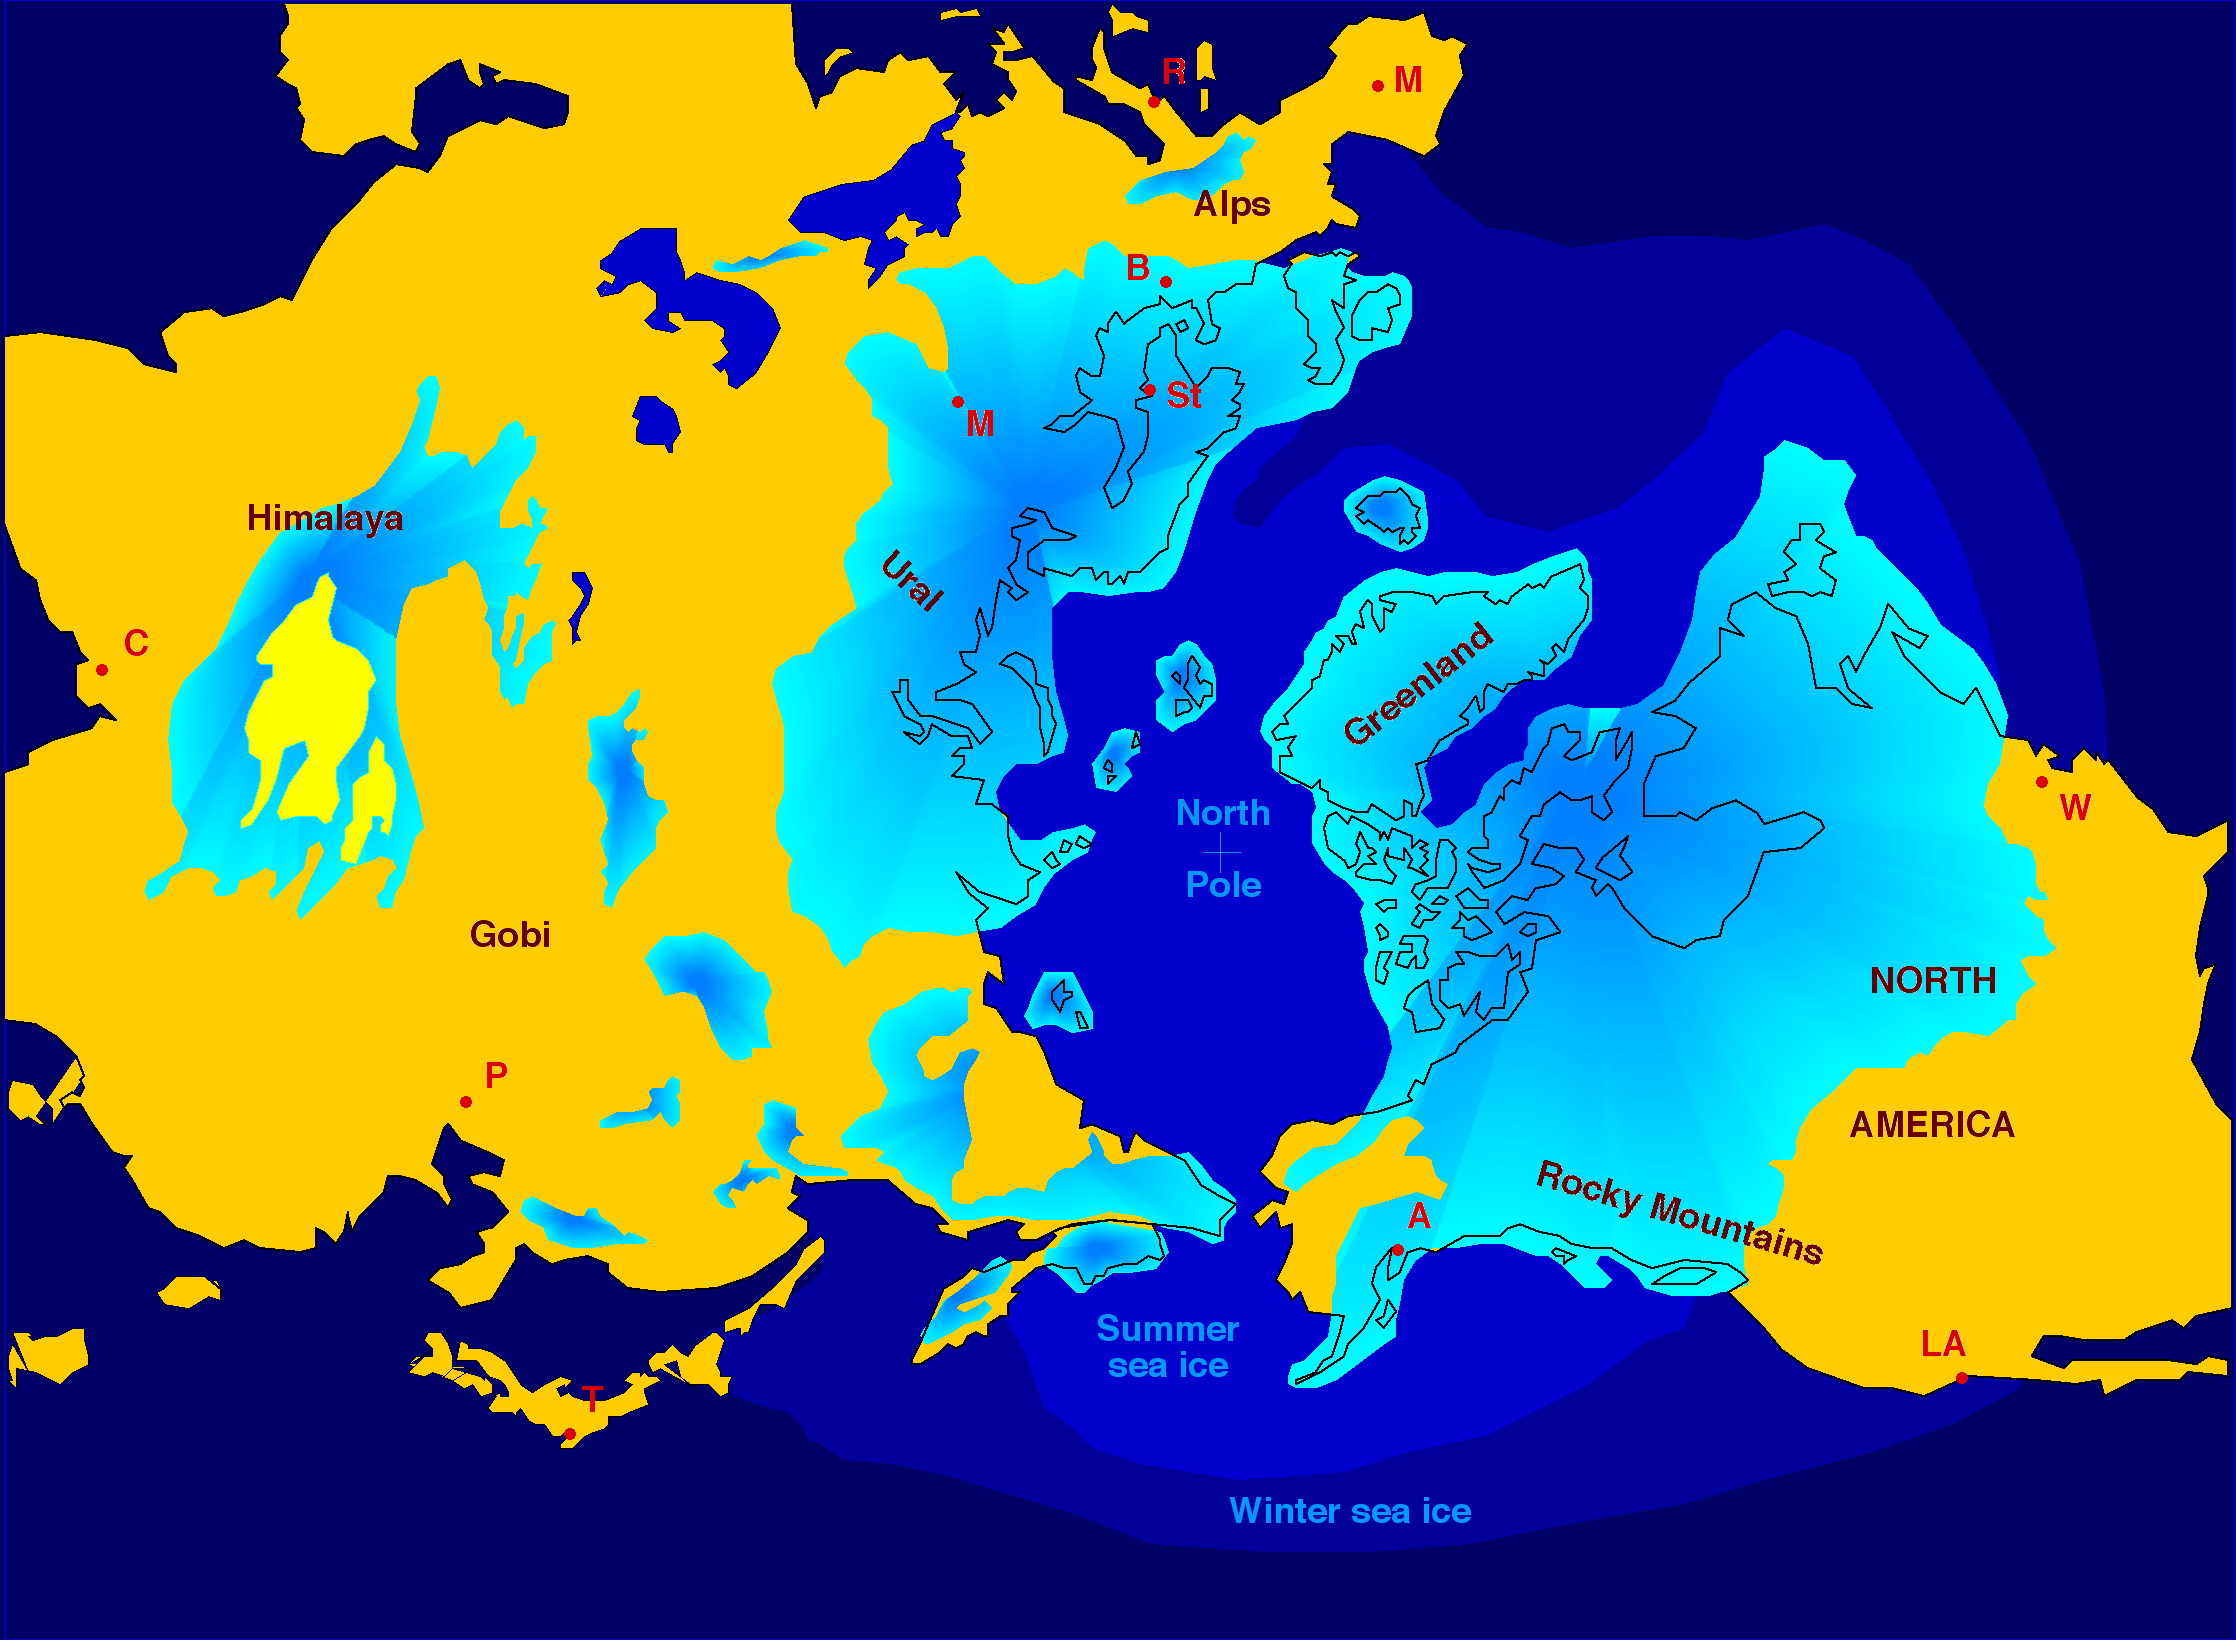
Figure 2: The blue areas show the distribution of ice sheets that covered the northern parts of North America, Europe and Asia at the peak of the last ice age, about 25,000 years ago. This was called the Last Glacial Maximum. At this time, ice sheets, also called glaciers, covered almost all of Canada, with the exception of a small area in Yukon. The ice sheet was about 3 km thick at its maximum. With the creation of these thick ice sheets, the level of the ocean dropped about 120 m. Image from: https://en.wikipedia.org/wiki/Quaternary_glaciation
The Pleistocene Epoch
The Pleistocene epoch began about 2,588,000 years ago - that is a little older than two and a half million years ago - and ended about 11,700 years ago. This was a time of dramatic climate swings back and forth between colder and warmer periods. During colder climatic times, glaciers, consisting of thick and extensive ice sheets, grew to cover almost all of Canada. At the peak, about 24,500 years ago, ice sheets covered all of Ontario, and almost all of Canada, including the northern United States and parts of Europe (Figure 2). During warmer climatic times, the ice sheets melted partly to free the land of ice.
Two different ice sheets covered North America. The ice sheet that covered the Ontario and the rest of Canada east of the Rocky Mountains is called the Laurentide ice sheet. The centre of the Laurentide ice sheet was located about where Hudson Bay is now located. The other ice sheet covered parts of the Rocky Mountains and is called the Cordilleran ice sheet.
Cold to Warm Climate Swings
During the Pleistocene epoch, there were at least four major periods when the Laurentide ice sheet and the Cordilleran ice sheet grew and contracted as the global climate cooled and warmed. The times when the ice sheets grew are named, from the oldest to the youngest: Nebraskan, Kansan, Illinoian, and Wisconsin. The climate was not always cold enough to preserve the ice sheets. When the climate shifted from cold periods to warm periods, the ice sheets melted. The times when the ice sheets melted and shrank during warm periods are called warm interglacial periods. The warm period are named, from oldest to youngest: Aftonian, Yarmouth, and Sangamon.
How Did The Ice Age Impact Ontario?
The ice sheets were "alive". They were moving, or flowing, most of the time. They seldom sat still for very long. It was the movement, with growth and melting of the glaciers, that played a major role in shaping Ontario's land surface:
the glaciers ground away at the land surface by a process called erosion, much like sandpaper removes the surface of wood, which shaped the rocky land into many different landforms;
the rock eroded by the glaciers was deposited as fine material beneath the glacier (called glacial till), as sand and gravel beneath, beside, and in front of the glacier (e.g., eskar, or esker), as clay that was deposited on the bottom of lakes, which formed when the glaciers melted and large lakes formed, as piles of mixed sand and gravel that was dumped in one place where the glacier slowed and stopped moving (e.g., moraine), and as other glacial landforms that formed by the action of the growth, movement, and melting of the glacier;
millions of depressions in the rocky land were carved by the glacier or created by islands of melting ice blocks; these depressions were filled with water from the melting glacier to become glacial lakes and melting ice created rushing river systems from the meltwater; the Great Lakes formed this way;
with the growth of the glaciers came a drop in sea level and with the melting of the glaciers came a rise in global sea level, both of which had profound influences on the shorelines of the continents; and
the weight of the glaciers depressed the surface of the land; the depressed land began to rise when the glacier melted because of a geological process called isostatic adjustment.
There were many other impacts of the glaciation on plant and animal ecosystems and on migration of humans into North America. At the peak of the ice age, when almost all of Canada was covered by up to 3 kilometers of ice, there was little or no life on the land as we know it. Its was a cold, hostile environment with no trees, no plants, no animals, and no humans living on the ice-covered land. There was one exception. There was an continuous land bridge that connected what we now call Siberia, Alaska and Yukon that was free of ice during the last ice age. That area is called Beringia.
Sinking And Rising Land - Isostatic Adjustment
One major, but subtle, impact of the ice sheet cover across Canada was the depression of the land. That is correct. Land beneath the ice sheet was pushed down. Believe it or not, ice is quite heavy. A cubic meter of ice weighs about 916 kilograms (2020 pounds). Imagine the weight of an ice sheet that was over 2 kilometers thick and that covered almost all of Canada! It weighed a lot. The ice sheet weighed so much that the land beneath the ice sheet was pushed down by the weight of the ice. Some estimates suggest the land beneath the thickest part of the glacier, outside of Canada, was pushed down by as much as half a kilometre, while the land outside the ice sheets bulged upwards by several hundred metres (Figure 3). In Ontario, it is estimated that the weight of the glacier pushed the land down by about 270 to 280 metres.
Figure 3: Isostatic adjustment: The weight of the glacier pushes down or depresses the land beneath the ice. The land beyond the limits of the glacier rose up a bit. When the glacier melted, the depressed part of the land rose up to return to the original shape of the surface. Image source.
Depressed Land - Sit On A Pillow
To understand what the weight of ice did to the land it covered, think of foam rubber pillow as the land. When you sit on the pillow, you act like the weight of a glacier. You push down the part of the pillow that is directly beneath your bottom. The parts of the pillow that lie beyond your bottom rise up a bit. That is exactly what happened to the land lying under the glaciers during the last Ice Age (Figure 3). The land was pushed down the most around Hudson Bay, where the ice sheet was thickest, and the weight of ice was greatest. The land was depressed the least in southern Ontario, where the ice sheet was thin and the ice weight of the ice sheet was much less compared to the center of the glacier over Hudson Bay (Figure 1).
Rising Land - Get Off The Pillow
When the ice sheets melted, and the weight of the ice disappeared, the land began to rise up, or rebound, returning towards its original shape. This process is called glacial isostatic adjustment, formerly known as isostatic rebound. The process of rising land is still taking place today, about 15,000 years after the last ice age started to end. For example, about 8,000 years ago, Cape Henrietta Maria, where James Bay and Hudson Bay merge, was more than 100 m below the surface of an ancient sea called the Tyrrell Sea (see below). By 7000 years ago, the Cape had emerged above the surface of the Tyrrell Sea.
Creation Of An Inland Sea - Isostatic Adjustment
As the last of the ice sheet melted away about 8,000 years ago, and before the land rebounded to its present level, seawater of ancestral Hudson Bay and James Bay flooded inland beyond the present-day shorelines (Figure 4 - darker coloured area). That influx of Tyrrell Sea seawater covered the land, filling the bowl created by the weight of the ice sheet. This expanded sea is called the Tyrrell Sea. On the bottom of the Tyrrell Sea, clay material, called Tyrrell clay, was laid down on top of the deposits left behind by the ice sheets. Preserved in that clay blanket are fossil shells of marine animals.
The blanket of marine Tyrrell clay lying on top of the deposits left by the ice sheet is one important piece of evidence that the depressed land was flooded by the ancient Tyrrell Sea after the ice sheet melted.
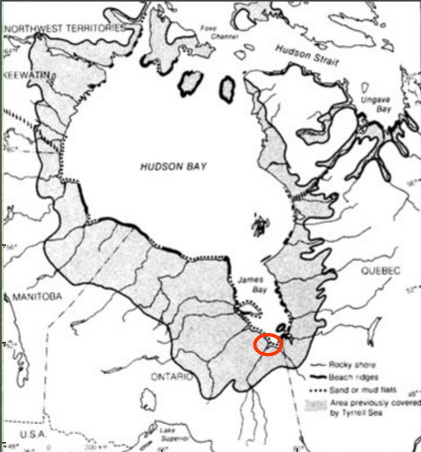
Figure 4: This image shows the inland extent of the Tyrrell Sea. The Tyrrell Sea was a inland, saltwater sea that covered the land adjacent to Hudson Bay and James Bay following the melting of the last ice sheet. The area covered by the Tyrrell Sea is marked in dark gray colour. The Tyrrell Sea flooded the land that had been pushed down by the weight of the last ice sheet that covered this area. Ignore the red circle. Image reproduced from the M.Sc. thesis of Melissa Dumbrell (2000): RIVERBANK CHARACTERISTICS AND STABILITY ALONG THE UPPER ESTUARINE REACHES OF THE MOOSE RIVER, NORTHERN ONTARIO, M.Sc. Thesis, University of Guelph, 243p. and reproduced from Martini, LP. (1986): Coastal Features of Canadian Inland Seas. In: Martini, I.P. (ed.), Canadian Inland Seas, Elsevier Science Publishers B.V., Amsterdam, pp. 117-142.
Raised Beaches and Creation Of New Land - Isostatic Adjustment
The blanket of marine clay material lying on top of the deposits left by the ice sheet is one piece of evidence that the land was depressed by the weight of the ice sheet and was flooded by the ancient Tyrrell Sea after the ice sheet melted. There is one other landform that tells us the depressed land started to rise and eventually emerged from below the Tyrrell Sea - the presence of beaches located far away from the present Hudson Bay and James Bay coasts - beaches (Figure 5)!
The ancient beaches formed over the last 8,000 years along the changing coast line of the former Tyrrell Sea. These old beaches are called raised beaches because they are located far away from the present shoreline of Hudson Bay and James Bay. In some places in Ontario, the old Tyrrell Sea shoreline beaches are 100 to 250 km farther inland than the present shoreline of Hudson Bay and James Bay!
When the land flooded by the Tyrrell Sea started to rise, the Tyrrell Sea drained back towards the present location Hudson Bay and James Bay. Each new shoreline was marked by a younger beach. Eventually, we reached the present-day shape of Hudson Bay and James Bay, but the history of the former beaches (Figure 5) tells us that the land has been rising for about the last 8,000 years.
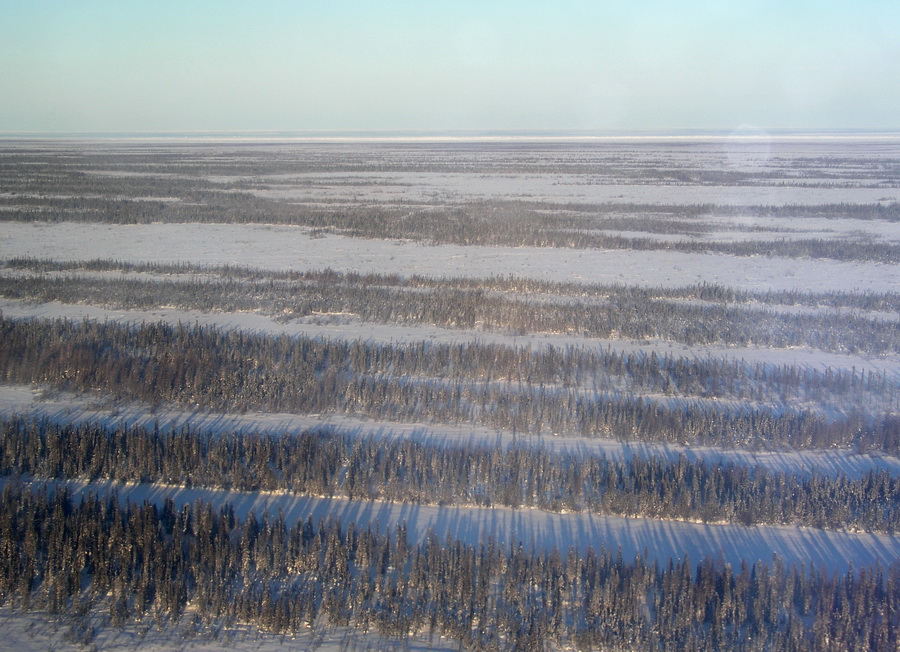
Figure 5: Tree cover defines many raised beaches that marked the former shoreline of the Tyrrell Sea. The Tyrrell Sea flooded the land at the end of the last ice age. Trees prefer to grow on the beach material which stands a little higher on the land. White, ice-covered bands between the tree-covered beaches are low lying peat lands, which do not support trees. The present-day shoreline of Hudson Bay occurs as a thin white band at the top of the photo between the pale blue sky and tree-covered beaches. Each parallel beach deposit marks the former shoreline. The shorelines formed as the land rose and the Tyrrell Sea drained back into Hudson and James bays over the past 8,000 years. Photo by Andy Fyon, east of Fort Severn, December 8, 2004.
Using Google Earth, you can actually see the light-coloured raised beaches, shown by the red arrows, visible on the satellite imagery (Figure 6 and 7). Muskeg, identified by the blue arrow in Figure 6 and 7, occurs between the raised beaches.
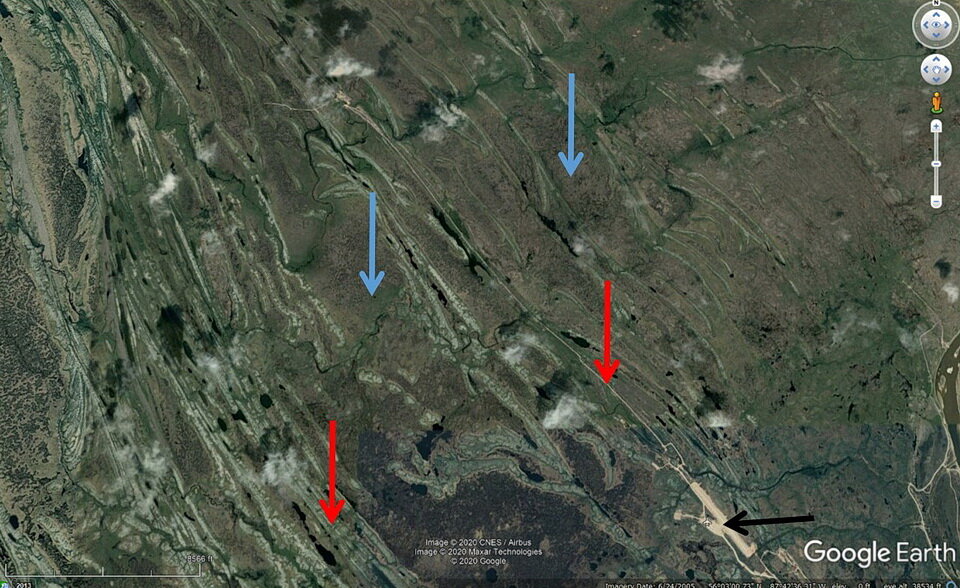
Figure 6: Google Earth image of the land northwest of Fort Severn (Ontario) showing the light-coloured raised beaches, shown by the red arrows. The raised beaches are sandy and reflect light, which is why they appear light coloured on this satellite image. Conversely, the muskeg areas, identified by the blue arrow, occupy the lower ground between the raised beaches. Because the muskeg areas don’t reflect light as well as the raised beaches, the muskeg areas are darker green in colour on the satellite image.
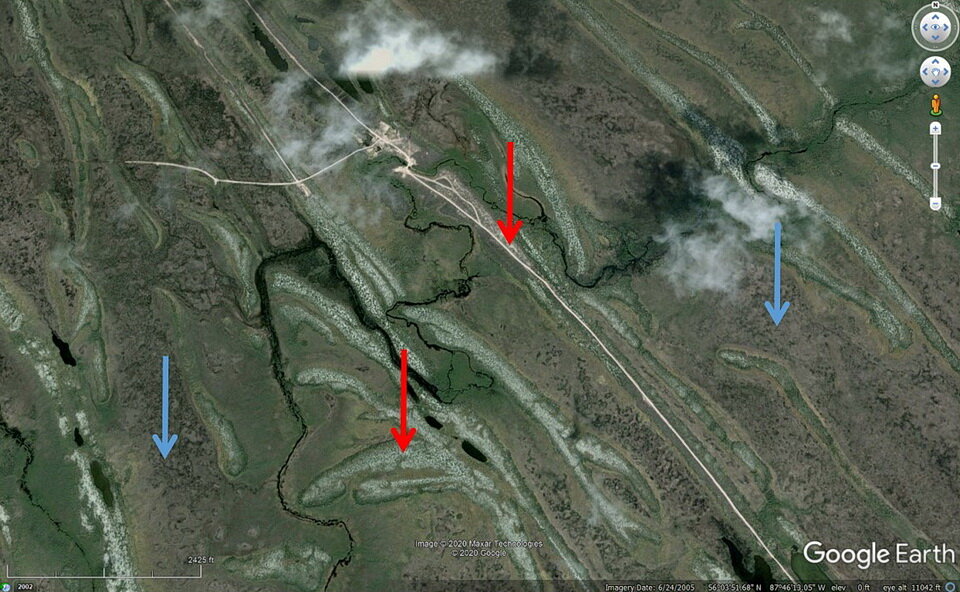
Figure 7: Google Earth image showing a more detailed view of the land northwest of Fort Severn (Ontario). The red arrows point to the light-coloured raised beaches. The raised beaches are sandy and reflect light, which is why they appear light coloured on this satellite image. Conversely, the muskeg areas, identified by the blue arrow, occupy the lower ground between the raised beaches. Because the muskeg areas don’t reflect light as well as the raised beaches, the muskeg areas are darker green in colour on the satellite image. Note that a road has been constructed along one of the raised beaches (top red arrow). The raised beach consists of sand and gravel, which provides engineering material for road construction. In addition, the raised beach is dry because it stands about 1 meter above the water saturated muskeg.
The lines of raised beaches located far away from the present-day coasts of Hudson Bay and James Bay are one of the most powerful visual reminders that the land has risen, and continues to rise, since the end of the last great ice age about 8000 years ago.
New Land - Eyes Of An Indigenous Elder
New land along the Hudson Bay and James Bay shore is being created at this very minute, as the land continues to rise and the Hudson Bay water drains off the raised land! In their lifetime, First Nation elders living along the Hudson Bay and James Bay coasts, in the communities of Fort Severn, Peawanuck, Attawapiskat, Kashechewan, Fort Albany and Moosonee, have seen the creation of new land as the water of the former Tyrrell Sea and the present-day Hudson and James bays continue to drain towards the centre of Hudson Bay! One estimate suggests that over the last 1000 years, this process of rising land, and draining of seawater cover in response to isostatic rebound, created about 30 km of new land along the Ontario part of Hudson Bay! That is the creation of about 3 km of new land every 100 years!
Future Of Hudson Bay
Geologists have measurements that indicate the land in the Hudson Bay region is still depressed and may have another 100 meters to rise. Note there is uncertainty in that estimate of remaining uplift because I cannot find a peer-reviewed analysis of the remaining uplift. The present average depth of Hudson Bay is about 100 meters, and it is about 270 meters at its deepest. When uplift is complete, the shape of present-day Hudson Bay will change as more land rises above the present-day ocean.
Recreate Raised Beaches On Your Kitchen Table
You can recreate the rising of the land, the creation of raised beaches, and the creation of new land along Hudson Bay and James Bay at your kitchen table. Lay a cooking plate that has a raised lip around its edge on the table. Cover the entire bottom of the pan with a little coloured water to represent land that was covered by the Tyrrell Sea immediately at the end of the ice age (Figure 8, top photo). Gently lift up one end of the pan to represent the rising land, leaving the other end of the cook plate hinged on the table. The water drains away from the raised end of the cook plate (Figure 8, bottom photo). When you lift one end of the cook plate by a tiny amount, a lot of cook plate becomes free of water (Figure 8, bottom photo). In the same way, the small rise of the land that was covered by former Tyrrell Sea creates a lot of new, dry land following the melting of the last glacier.
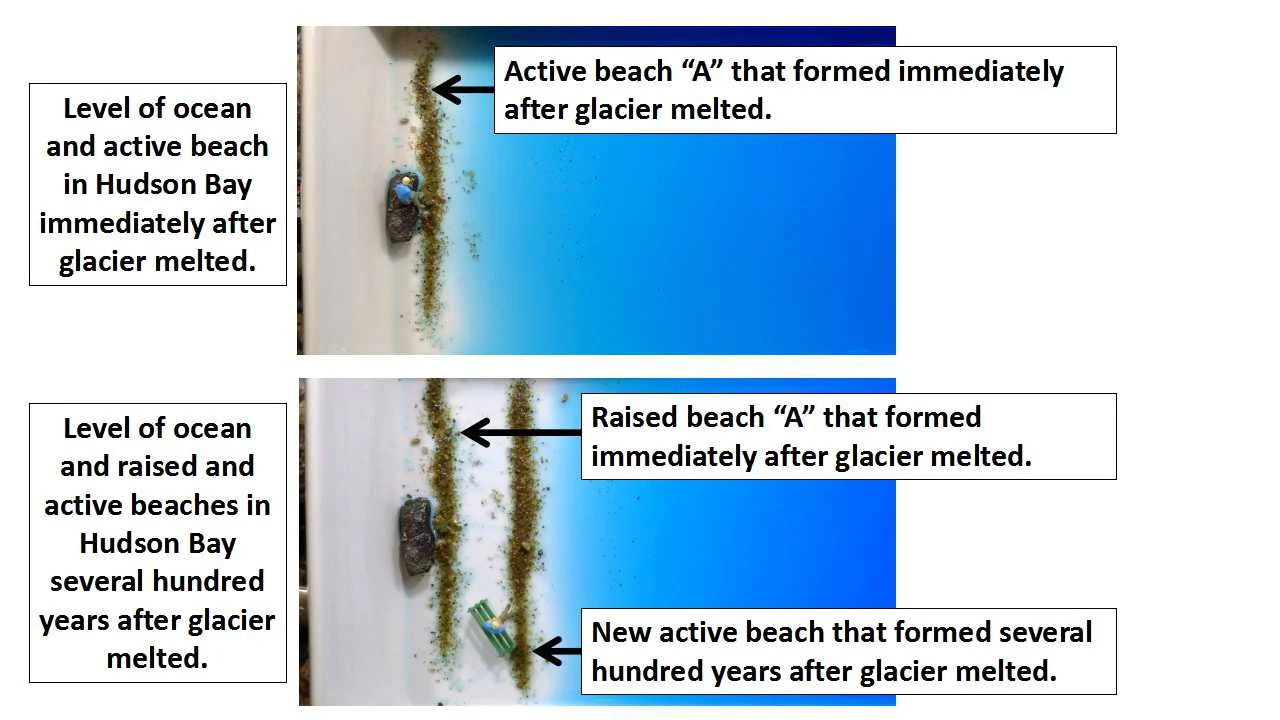
Figure 8: You can recreate the impact of a melting glacier, the rising land, and the creation of new land on your kitchen table using this experiment. These two photos look straight down on a make-believe part of Hudson Bay shoreline (left side of photo). The center of Hudson Bay lies to the right side of the photo. The land is rising on the right side of the photo. The top photo shows an active beach that forms at the high tide mark of Hudson Bay immediately after the glacier melted. The bottom photo shows what happens as the land continues to rise at the left end for several hundred years by the process of isostatic adjustment. The original beach "A" is now stranded well away from the active shoreline and a new active beach forms along the new shore line, where new land has been created. Photo by Andy Fyon, January 25, 2017.
Summary
During the last ice age, all of Ontario was covered by an ice sheet. The weight of the ice sheet pushed the land down. When the ice sheet started to melt, between 15,000 and 8,000 years ago, the land was flooded by the Tyrrell Sea and the land started to rebound up. The land is rising at about 1.3 meters each 100 years along the south shore of Hudson Bay.
Old beaches that mark the mark the ancient shoreline of the Tyrrell Sea are located as far as 250 kilometres inland from the present shore of Hudson Bay and James Bay. The Tyrrell Sea drained north as the land rose as the ice sheet melted. New dry land, formerly covered by the Tyrrell Sea, emerged until we arrived at the present shoreline of Hudson Bay and James Bay. But the rising land has not stopped. Some estimates suggest that the Hudson Bay area still has about another 100 metres to rise. It will take about 10,000 years for the Hudson Bay region to fully recover from the weight of the last ice age, and there is still more land that will rise above the surface of the ocean.
While the geological history of Ontario is cool, that geological history also impacts all our lives. Isostatic rebound is a factor that influences the water levels in the Great Lakes, which affects recreational use, Great Lake shipping, and shorelines. Isostatic rebound is expanding the size of Ontario as Hudson and James bays drain to the north. Beaches that formed as the land rose and the the ocean drained north sustain different vegetation and are used by animals for dens. The "Ontario beneath our feet" is fundamental to Ontario's ecology, economy and quality of life.
Have A Question About This Note?
Andy Fyon: Jan. 29/17; April 6/17; Nov. 17/20.