Ontario: Rising Sea Levels: Chapter 1 - Cause And Evidence
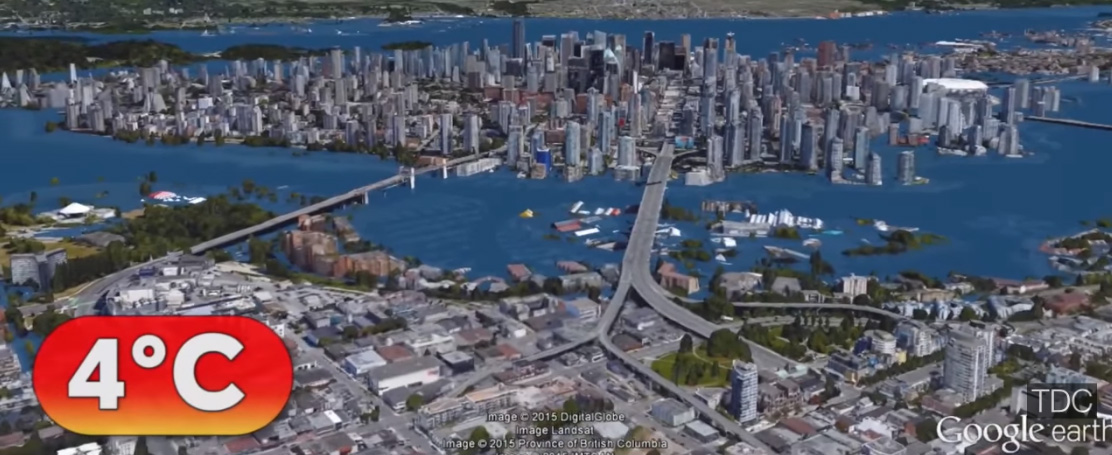
Figure 1: A cartoon that shows the possible extent of ocean flooding affecting the City of Vancouver, based on some assumptions, including a global climate temperature rise of 4C. This image comes from the video: The World After Sea-level Rise.
Sea Level Rise: Impacts?
Sea levels have gone up and down throughout the history of the Earth. But, during the last 20 years, there has been a lot of interest on changing sea level. Why? Rising sea levels create a threat to the safety of coastal countries and cities. Climate change, rising sea levels, and the many associated changes to ocean waters, have the potential to:
flood land;
contaminate fresh groundwater and surface water resources with salt water;
destroy marine food sources;
destroy economies;
disrupt the land and marine environments;
flood and destroy communities;
flood and obliterate island countries;
create millions of climate change refugees; and
disrupt society as we know it.
Many models have been created to illustrate the impact of rising sea levels on cities (Figure 1).
In this post, I present some observations on the complex and sometimes controversial topic of rising sea levels. I draw on geological information, where available, to help understand what happened to sea levels in the past, to understand some of the challenges of researching changing sea levels, and to understand what may happen in the future if sea levels continue to rise. I state at the outset that I am not an expert on the topic of changing sea levels. I am just sharing information that is widely available.
Questions
I have often been asked two questions by friends who live in the coastal communities along Hudson Bay and James Bay:
"is sea level really rising"; and
"if sea level is rising, will it affect the near-coastal communities along Hudson Bay and James Bay, Ontario".
People living in Ontario, along the Hudson Bay and James Bay coasts (Fort Severn, Peawanuck, Attawapiskat, Kashechewan, Fort Albany, and Moosonee), have good reason to be concerned about rising sea level. Their communities are located close to present-day sea level (Figure 2):
Fort Severn: airport located 16 m (52 feet) above sea level
Peawanuck: airport located 52 m (173 feet) above sea level
Attawapiskat: airport located 9 m (30 feet) above sea level
Kashechewan: airport located 11 m (35 feet) above sea level
Fort Albany: airport located 14 m (47 feet) above sea level
Moosonee: airport located 9 m (30 feet) above sea level
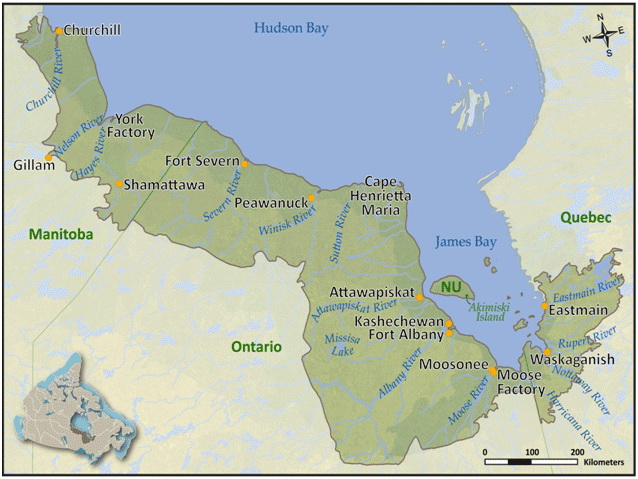
Figure 2: Location of the Ontario communities located along the coasts of Hudson Bay and James Bay: Fort Severn, Peawanuck, Attawapiskat, Kashechewan, Fort Albany, and Moosonee. Image source: Biodiversity Canada Hudson Plains Ecozone and Evidence for key findings summary.
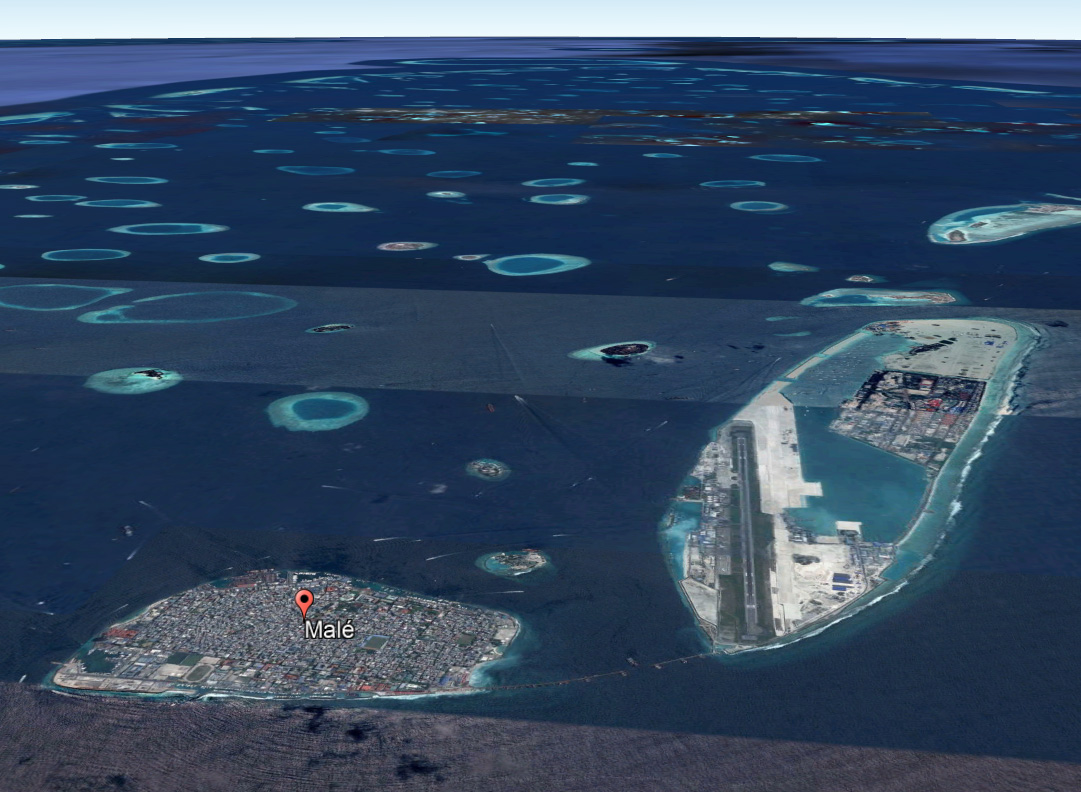
People elsewhere who live close to the oceans also have good reason to be concerned about rising sea levels.
So, is there a geological story related to changing sea levels? Absolutely yes! There is geological information to help us understand what happened to sea levels in the past, what is happening now to sea levels, and what is likely to happen to sea levels in the future. This understanding is important if we are to predict what may happen in the future to near-coastal communities around Hudson and James bays.
Chapter 1: Three Parts To The Story
I approach the story of changing sea levels in two posts. This post (Chapter 1) describes factors that cause changes to sea levels, what we know about past and present changes to sea levels, and what is predicted to happen to sea levels in the future. In a separate, future post (Chapter 2), I will apply this information to ask if future flooding of the near-coastal communities of Fort Severn, Peawanuck, Attawapiskat, Kashechewan, Fort Albany, and Moosonee (Figure 2) is a possibility, based on changing sea levels.
I have divided this post (Chapter 1) into three parts:
Part A describes factors that cause changes to sea levels;
Part B describes the past and present changes to sea levels over geological time, up to the present day; and
Part C describes what may happen to future sea levels.
The information in Parts A, B and C is relevant around the world, not just Hudson Bay and James Bay areas.
Part A: What Causes Sea Level To Change?
Sea levels change when the volumes of the Earth's oceans change. It is not easy to measure the volume of the ocean, so scientists talk about surface level of the oceans when they describe sea level. However, the surface level of the ocean changes all the time due to tides, wind, and other factors. Therefore, scientists calculate the "Global Mean Sea Level" (GMSL). GMSL is the mid-point between high and low sea levels measured over time.
Is Sea Level The Same Everywhere?
No, the height of the ocean surface is not the same everywhere (Figure 3). The hot red coloured areas (Figure 3) are regions where the sea surface has risen up to 10 mm per year. The cold blue areas (Figure 3) show regions where the sea surface has dropped up to 10 mm per year. The surface level of the ocean is not the same everywhere. The bulges and bowls in the surface of the oceans change at different rates, in different places, over time. These differences shift around the Earth.

Figure 3: This image shows the surface height of the oceans. This image shows the 20 year trend of rising surfaces across the Earth from 1993 to 2016. The hot red coloured areas show regions where the sea surface has risen up to 10 mm per year. The cold blue areas show regions where the sea surface has dropped up to 10 mm per year. The surface height of the ocean is not the same everywhere. Image source: Global Mean Sea Level by NASA.
What Factors Affect The Local Sea Level?
Several factors affect local sea level, including tides, wind, heat and freshwater exchange at the surface of the ocean, and associated changes in ocean circulation, called currents. When the shape of the ocean's surface changes, sea level at that point also changes. Local sea level can also change if the local land rises or sinks due to geological processes. One geological process responsible for changing the elevation of land is the growth and shrinkage of land-based glaciers. See the post entitled The Geology of Rising Land - Isostatic Rebound to learn more about the relationship between glaciers and sinking or rising land in Ontario.
What Factors Affect Global Mean Sea level?
Changes to GMSL are caused mostly by changes in climate. The influence of climate on GMSL is well documented over the last 550 million years, or 12%, of Earth history. For example, during warm climate periods, land-based glaciers melt, releasing lots of meltwater that flows into the ocean, causing the volume of the oceans to increase. That addition of meltwater accounts for about 68% of rising sea level seen today. During periods of cool climate, land-based glaciers expand, trapping moisture that evaporated from the oceans, and sea levels drop.
Change in the average global temperature affects the expansion or shrinkage of the volume of the oceans. During a period of warm global temperature, seawater heats up and expands. This is called thermal expansion (Figure 4) and it accounts for about 35% of rising sea level seen today. During a period of cool global temperature, seawater cools and shrinks in volume, a process called thermal contraction.
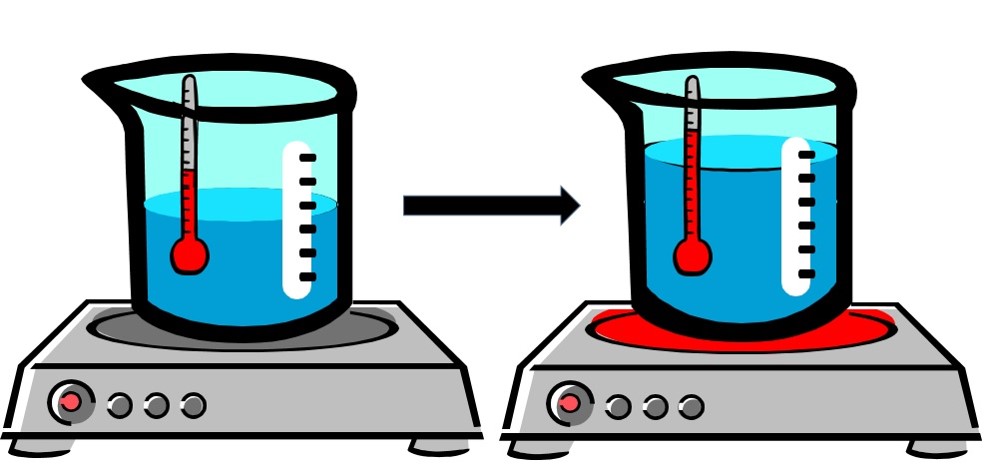
Figure 4: This cartoon shows what happens when cold water (on the left) is heated (on the right). When water is heated, it expands! This is called "thermal expansion". Image source: Thermal expansion and why it matters to you!
What Factors Affect Global Temperature, Climate, And Sea Level
From the beginning of Earth time, the Earth has experienced many warming and cooling cycles. Using geologic data, it is possible to look back at least 540 million years to estimate past Global temperature of the Earth's atmosphere. There are long-term and very short-term fluctuations in average Global temperature (Figure 5).
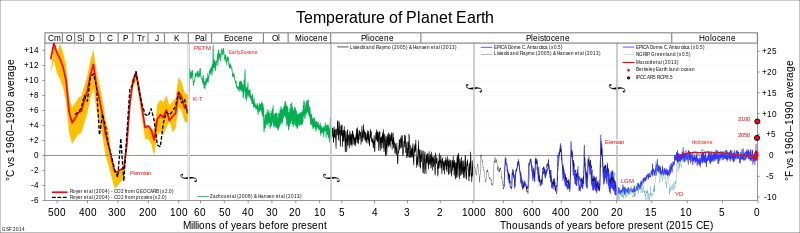
Figure 5: Global average temperature estimates for the last 540 Million years. The thin horizontal black line that marks the "zero" temperature change line. Parts of the graph that fall above that "zero" line show times when the Global temperature was higher compared to the Earth's average temperature measured between 1960 and 1990. Parts of the graph that fall below the "zero" line are times when the Global temperature was lower compared to the Earth's average temperature measured between 1960 and 1990. This image is created by "sticking" 5 images together, so the time scale is NOT the same across the single image. Image from Wikipedia - Geologic temperature record.
Three factors cause changes to the average Global temperature of the Earth:
sunspot activity
amount of greenhouse gas in the Earth's atmosphere.
The Milankovitch Cycles describe changes to the shape of the Earth’s orbit around the Sun and the angle of the Earth’s rotation (Figure 6). Milankovitch cycles operate on three time scales: a) 23,000 years (precession); b) 41,000 years (axial tilt); and c) about 100,000 years (eccentricity).
Although too complex to discuss in detail, the Milankovitch Cycles affect the amount of solar energy that falls on parts of the Earth. Sunspot activity is another factor that affects average Global temperature. There are several solar cycles that are too complex to review in this post, but one well documented solar cycle is the 11-year sunspot cycle. Sunspots also affect the amount of solar energy that reaches the Earth. Now, changes in the amount of solar energy reaching the surface of the Earth can create contrasts between the seasons. That affects the Earth's climate, the growth or melting of land-based glaciers, the volume of the oceans, thermal expansion or contraction of ocean water, and therefore, influences sea level.
The Milankovitch Cycles are responsible for about 85% of changes in the Global temperature, which therefore, affects the Earth's climate,
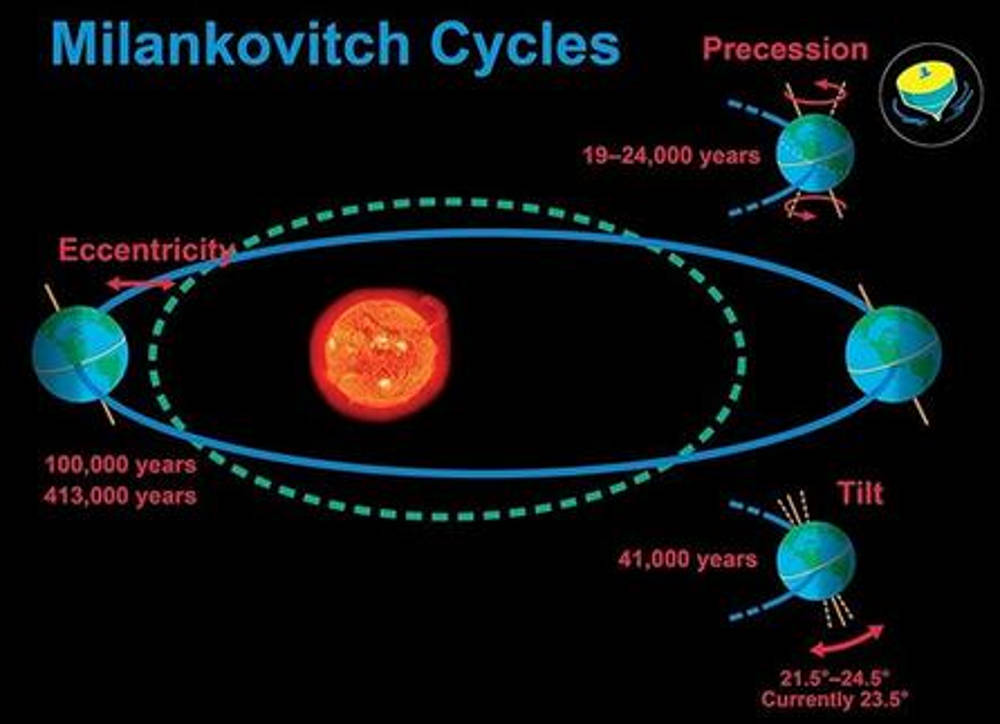
Figure 6: Milankovitch Cycles are responsible for about 85% of changes in the Earth's Global temperature. The Milankovitch Cycles describe changes to the shape of the Earth’s orbit around the Sun and the angle of the Earth’s rotation. Those changes can influence the contrasts between seasons on Earth, which can influence the Earth's climate, growth or melting of glaciers, and therefore changes in the volume of water in the oceans. Image source.
The third factor that affects the average Global temperature of the Earth, and therefore the Earth's climate, is the amount of greenhouse gas in the Earth’s atmosphere. Carbon dioxide (CO2) and methane (CH4) are two greenhouse gases. Greenhouse gases act like a blanket that covers the Earth. Solar energy passes through the blanket to warm the Earth, but the blanket blocks some of that heat from escaping back into space. As a result, the Earth's atmosphere, and oceans, warm up. That changes the Earth's climate, and therefore, sea level.
Concentration Of Carbon Dioxide Gas In The Atmosphere Over The Last Five Hundred and Fifty Million Years
Given that the greenhouse gases act like a thermal blanket, which helps to raise the average Global temperature of the Earth, affects the Earth's climate, and contributes to sea level change, what do we know about the past concentration of the greenhouse gases in the Earth's atmosphere? Scientists can directly, and indirectly, measure the concentration of greenhouse gases in the Earth's atmosphere. We will consider only carbon dioxide (CO2), for simplicity. Carbon dioxide concentrations in the Earth's atmosphere have fluctuated a lot over the past 550 million years (Figure 7).
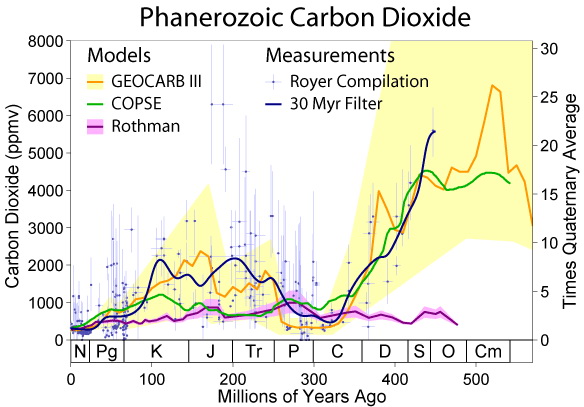
Figure 7: This is a bit of a complicated diagram that show the inferred concentration of CO2 in the Earth's atmosphere over the last 550 million years. The vertical axis shows CO2 concentration in parts per million (ppm). The horizontal axis shows time, in millions of year, from present. The time gets older going from left to right on that horizontal axis. Different estimates of CO2 concentration are shown in different colours. The simple interpretation is that CO2 in the Earth's atmosphere was as high as about 7000 ppm about 550 million years ago and fluctuated during progressively younger time to the present concentration of about 400 ppm. Image from: Carbon dioxide in Earth's atmosphere.
The CO2 fluctuations ranged from an high of about 7,000 parts per million (ppm) during the Cambrian period, about 500 million years ago, to as low as 180 ppm during the Quaternary period, about 2 million years ago (Figure 7).
Concentration Of Carbon Dioxide In The Atmosphere Over The Last Four Hundred Thousand Years
Over the most recent 400,000 years of Earth history, the concentration of CO2 in the atmosphere has fluctuated between about 300 parts per million (ppm) and 180 ppm (Figure 8). However, in the year 2013, the CO2 concentration jumped dramatically to over 400 ppm (Figure 8)! Today, January 22, 2018, the concentration of CO2 in the Earth's atmosphere is 406 ppm. The concentration of CO2 in the Earth's atmosphere is higher today than it has been been in the past 400,000 years (Figure 8)!
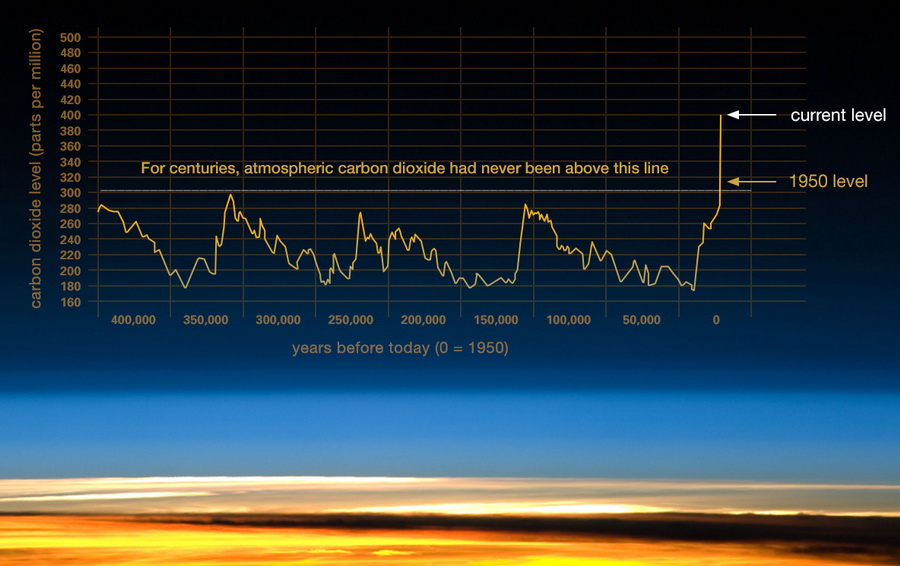
Figure 8: This image shows a more detailed summary of CO2 in the Earth's atmosphere over the last 400,000 years, based on analyses of atmosphere gas bubbles that were trapped in glacial ice. That concentration ranged between an high of about 300 parts per million (ppm) and a low of about 180 ppm. What is dramatic is the jump of CO2 in the atmosphere in very recent times (right end of image) to over 400 ppm in the last 20,000 years. Most of that jump took place in the last 300 years!. Concentration of CO2 in the Earth's atmosphere is higher today than it has been been in the past 400,000 years. In 2013, CO2 levels exceeded 400 ppm. This increase in CO2 is related to burning of coal, oil and natural gas. Image source: NASA - The Relentless Rise of Carbon Dioxide.
Concentration Of Carbon Dioxide Gas In The Atmosphere Over The Last Eight Thousand Years
The CO2 concentration in the Earth's atmosphere was relatively constant over the last 8,000 years at 260 to 280 parts per million (ppm; Figure 9). About 250 years ago, the CO2 concentration started to rise dramatically (Figure 9).

Figure 9: Concentration of CO2 in the Earth's atmosphere in parts per million (ppm) over the past 8,000 years. The blue and green lines show CO2 measured from atmospheric gas bubbles trapped in old glacial ice (blue = Taylor Dome ice cores; green = Law Dome ice core) and the red line represents measurements from the atmosphere taken on top of Mauna Loa, Hawaii. Image source: How reliable are CO2 measurements?
We can be a bit more specific about that dramatic jump in CO2 concentration. Over the past 10,000 years, up to about the year 1750, the CO2 concentration averaged about 280 ppm. Since the year 1750, the CO2 concentration jumped dramatically from 280 ppm up to about 407 ppm in the year mid-2017. That is a 45% increase in the CO2 concentration in the Earth's atmosphere since about the year 1750. Now, the year 1750 is important because that date was about the start of the Industrial Revolution. What happened during the Industrial Revolution that correlates with the dramatic increase in the CO2 concentration? NASA attributes the burning of coal, oil and natural gas by humans during the Industrial Revolution as the major factor that caused the recent jump in CO2 concentration in the Earth's atmosphere.
CO2 Concentrations, Climate Change And Recent Ice Ages
So, we have seen that CO2 concentration in the Earth's atmosphere jumped dramatically following the start of the Industrial Revolution. Because CO2 is a greenhouse gas, too much CO2 in the atmosphere causes the Earth's average global temperature, climate, and oceans to warm up. Remember that a warm climate causes glaciers to melt, the volume of oceans to expand, and sea level to rise. The opposite occurs when the atmosphere contains lower concentrations of CO2, creating a cooler climate, causing glaciers to grow, and sea level to fall.
Carbon dioxide concentration in the Earth's atmosphere fluctuated over the past 800,000 years (Figure 10). During times when the concentration of CO2 was above 230 parts per million (ppm - yellow coloured areas on Figure 10), the Earth's atmosphere, climate, and oceans were warm, glaciers melted, and sea level rose. These are called interglacial periods. During times when the concentration of CO2 was below 230 ppm (blue coloured areas on Figure 10), the Earth's atmosphere, climate, and oceans cooled, glaciers grew, the Earth experienced several mini ice ages (blue coloured time periods on Figure 10), and sea level dropped. These are called glacial periods.
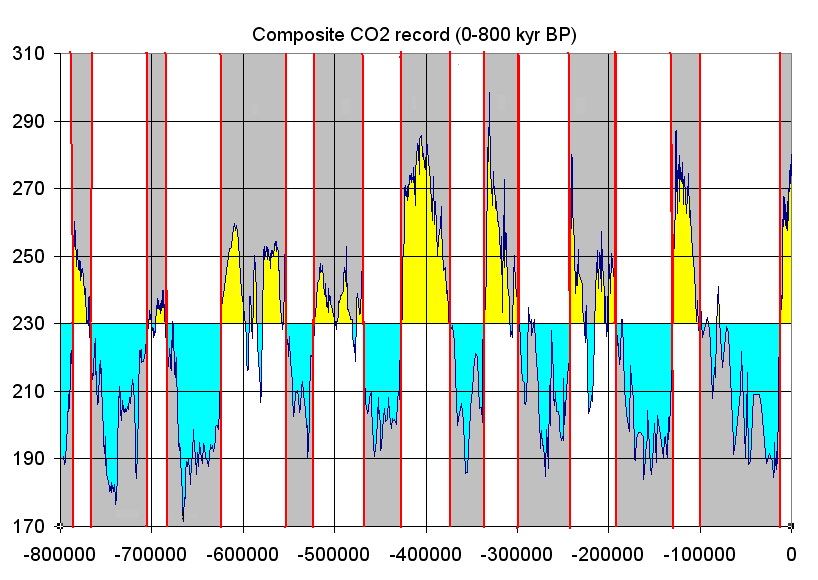
Figure 10: This graph shows the concentration of the greenhouse gas CO2 in the Earth's atmosphere (vertical scale), as measured by gas bubbles trapped in ice core samples from glaciers, over the last 800,000 years. The vertical scale shows the concentration of CO2 in parts per million (ppm). The bottom, or horizontal axis, shows time measured back from today. Negative time, such as -400000, means 400,000 years before today. The blue-coloured areas show periods of time when parts of the Earth were affected by ice ages - times when glaciers grew. These are called "glacial" periods. The yellow-coloured area show periods of times when parts of the Earth were not affected by ice ages - times when glaciers melted. These are called "interglacial" periods. A concentration of 230 ppm CO2 in the Earth's atmosphere is taken as the change between the blue, cool glacial and the yellow, warm interglacial periods. Image source: Wikipedia Glacial Period.
So, the concentration of the greenhouse gas CO2 in the Earth's atmosphere affects the average Global temperature, the Earth's climate, the start and end of recent mini-ice ages, and sea level.
Part A Summary: What Causes Sea Level To Change?
Three factors contribute to sea level change: a) Milankovitch Cycles; b) sunspot activity; and c) amount of greenhouse gas in the Earth's atmosphere. Geological records show that:
CO2 concentration in the Earth's atmosphere has increased 45% to 406 ppm since the year 1750, the start of the Industrial Revolution, and is at the highest concentration experienced in the last 800,000 years;
increasing CO2 in the Earth's atmosphere warms the Earth's atmosphere, climate, and oceans, causes land-based glaciers to melt, the ocean volume to increase, and sea level to rise;
decreasing CO2 in the Earth's atmosphere cools the Earth's atmosphere, climate, and oceans, causes land-based glaciers to expand, the ocean volume to decrease, and sea level to drop.
Sea level change is a complex story, but there is a strong link to greenhouse gas concentration in the Earth's atmosphere.
Part B: Past And Present Sea Levels
In Part B, we examine in more detail changes to sea levels over geological time. Geologists use the expression "the past is the key to the future". By studying and understanding past, we gain an understanding of what is likely to happen in the future. This expression applies to changes in sea level. Predicting sea levels into the future is NOT easy. There is much debate about this topic and the best approach to predict future sea levels. Having said that, the data strongly show that sea level fluctuated over geological time and sea level is rising now.
Geologists have estimated the sea level as far back as 540 million years ago (Figure 11). This is just an estimate and there are a great many inaccuracies; however, the trends are likely correct.
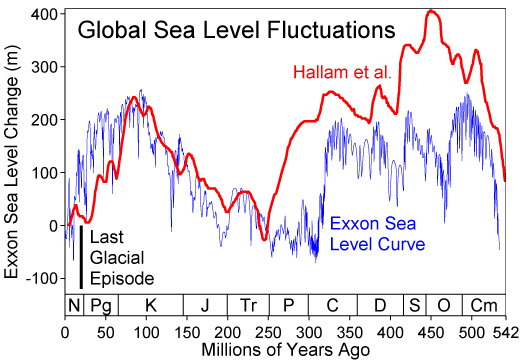
Figure 11: A cartoon that illustrates two different estimates of sea level over the last 500 million years. The black vertical line on the left shows the range of the sea level during the last great ice age, about 25,000 years ago. At that time, the sea level was about 120 to 130 metres lower than today. Image source: Past Sea Level.
While this is an interesting retrospective of past sea levels, we are interested in recent changes to sea level in order to consider the fate communities close to the shores of Hudson and James bays.
Sea Level Rise After The Ice Age Over The Last Twenty Thousand Years
Over the past 20,000 years, GMSL has risen about 120 metres (393 feet)! That is a big rise in sea level (Figure 12)!
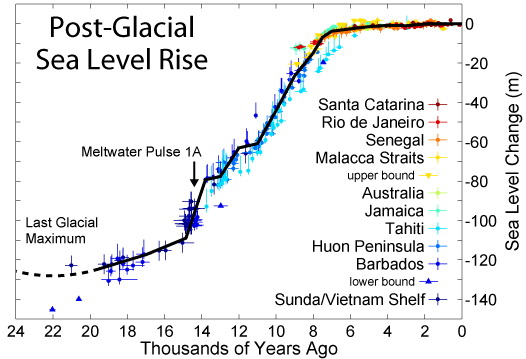
Figure 12: This figure illustrates the level of the sea over time. The sea level change is measured relative to present sea level, which has arbitraily been given the value of "0". The chart shows very clearly that sea level rose by about 120 metres (393 feet) over that last 20,000 years. This rise in sea level started about 20,000 years ago, at the end of the last great ice age, when the huge volumes of glacial ice melted. Melting glaciers released meltwater that flowed into the oceans. Image source: wikipedia - Sea Level Rise.
Why did sea level start to rise about 20,000 years ago? The answer lies in melting of land-based glaciers. About 25,000 years ago, just about all of Canada, the northern United States, northwestern parts of Europe, and Antarctica were covered by thick sheets of glacial ice (Figure 13). That was at the peak of the last great ice age.
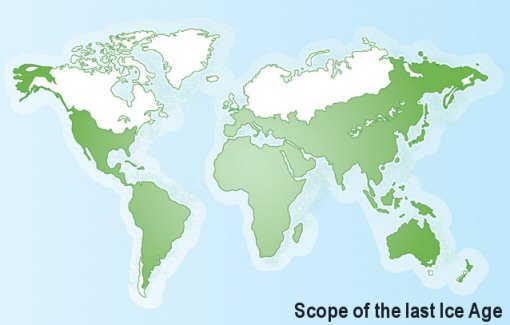
Figure 13: This cartoon shows the distribution of glacial ice, in the northern hemisphere. The ice cover is coloured in white, which covered North America, Greeenland, and northwestern Europe during the peak of the last ice age, about 25,000 years ago. Antarctica was also covered by glaciers at this glacial maximum, but it is not illustrated on this cartoon. Image source: Climate change and human evolution.
At that time, the Earth's climate was cooler, ocean water evaporated and accumulated as snow and ice on the land, and land-based glaciers grew. The volume of the cooler ocean also contracted, due to thermal contraction. Those two factors caused sea level to drop by at least 120 metres (393 feet) at the peak of glaciation about 25,000 years ago (Figure 12). Starting about 20,000 years ago, the Earth's climate began to warm and land-based glaciers began to melt, releasing huge volumes of meltwater that flowed back into the oceans. The volume of the warmer oceans also expanded due to thermal expansion. Those two factors caused sea level to rise by at least 120 meters (393 feet) over the last 20,000 years (Figure 12).
Sea Level Rise Over The Last Three Thousand Years
Based on many geological and archaeological observations, scientists agree that over the last 2,000 to 3,000 years, sea level has been stable, or rose very slightly, at a rate of 0.07 mm per year (Figure 13).
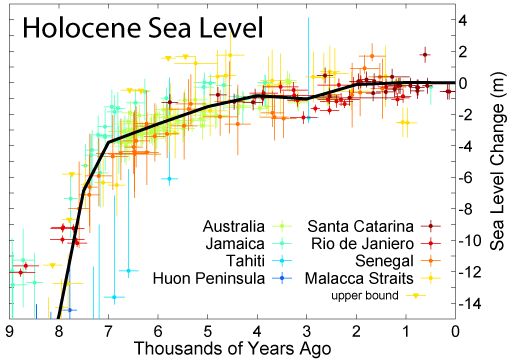
Figure 13: This figure shows the sea level change over the past 8,000 years during the geological time called the Holocene. The horizontal axis shows time, in thousands of years in the past. The vertical axis shows the change in sea level in metres. The key time period is present back to 2000 years, when the seal level was constant, or rose at a very slow rate. The big sea level rise from 8,000 years to about 4,000 years illustrates the result of warming climate and the last melting of the glaciers that grew during the last great ice age. Image source: Sea level change in the Middle Ages and the Little Ice Age.
But, something changed around the year 1850 when sea levels started to rise more rapidly - see Figure 14, below!
Sea Level Rise Since The Year 1850
Between the years 1850 and 1900, sea level began to rise faster than during the previous 3,000 years (Figure 14).
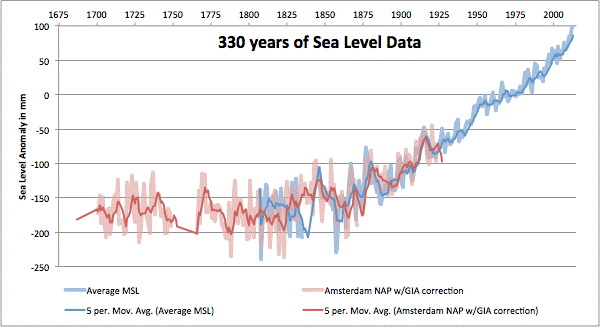
Figure 14: This image shows measured sea levels in the Netherlands starting during the year 1683 to present day. This is one example of the many global records that exist for historic sea level. Image source: 330 Years of Sea Level.
Why happened to trigger this recent rise in sea level? One explanation was the Industrial Revolution (1760 to 1850), when humans started to burn a lot of the fossil fuels peat and coal - forms of non-renewable energy. Burning of fossil fuel was compounded by the more recent burning of oil and natural gas. Burning these fossil fuels produced a lot of waste CO2 gas that entered into the Earth's atmosphere. Human activities have increased the concentration of CO2 in the Earth's atmosphere by more than 45% since the start of the Industrial Revolution in 1750!
Many scientists conclude the recent addition of the greenhouse gas CO2 to the atmosphere is the main factor that caused the Earth's recent climate to warm, land-based glaciers to melt, ocean waters to expand, and sea levels to rise since about 1850.
How Fast Has Sea Level Risen Since The Year 1850?
Here are some recent estimates of the rate at which sea level is rising:
between the years 1900 and 2000, sea levels rose at about 1.4 mm per year;
by the year 2010, sea levels were rising at about 3 mm per year;
in July and September 2017, sea level was rising at about 3.4 mm per year and 3.3 mm per year respectively.
So, based on measurements, it is generally accepted that GMSL is presently rising at a rate of about 3.3 to 3.4 mm per year.
Part C: Future Trends In Sea Levels
When we ask "what will happen to sea level in the future", we leave the realm of observation and measurement and we enter the realm of "predictive modelling". Scientists use past and present observations and measurements to predict what may happen in the future. That prediction is called a model. You can think of a predictive model as the likelihood that something will happen in the future. No one can be 100% certain about the future, especially in regards to climate, because climate conditions, and its influence on glaciers and oceans, can change in ways we do not presently understand. There are uncertainties! However, many scientists from around the world created several different models that predict the Earth's climate will continue to warm and sea levels will continue to rise into the future.
Estimates of Future Sea Level Rise
In January 2017, a very important report was released by the National Oceanic and Atmospheric Administration, which examines the impacts of sea level change on the United States. The predictions are relevant to the rest of the world. That report makes two very important predictions about the predicted GMSL in the year 2100:
the sea level will continue to rise at a minimum rate of 3.3 to 3.7 mm per year, which translates to a minimum rise of GMSL of about 0.3 metre (300 mm or about 1 foot) by the year 2100;
in the worst case, GMSL will rise at a rate of 30.5 mm/year, which translates to a worst case rise of GMSL of about 2.5 metre (2500 mm or about 8.2 feet) by the year 2100.
The minimum and "worst case" estimates differ because the "worst case" recognizes factors that we don't fully understand, such as the surprising and increasing rate of melting of land-glaciers in Greenland and Antarctica. Note that the year 2100 is only 82 years away - well within the lifespan of a single generation. Your children and grandchildren will likely witness and experience the results of the predicted sea level rise.
The Intergovernmental Panel on Climate Change (IPCC)
Some people challenge the accuracy of measurements and predictions about future climate change and sea level changes. To address those concerns, a global organization called The Intergovernmental Panel on Climate Change (IPCC) was established in 1988 by the World Meteorological Organization (WMO) and United Nations Environment Programme (UNEP). The role of the IPCC is to assess the science related to:
climate change;
impact of climate change; and
options to deal with climate change.
Thousands of scientific and policy people from around the world, and many different countries, are involved in the IPCC science, scientific reviews, and assessments. The general predictions about future sea levels comes from the large global community of science and policy experts who collectively test the underlying science, the predicted future trends, and the several independent predictive models about future climate trends, including sea level. That informed community has arrived at the same general conclusions. Sea level is rising now, will continue to rise into the future - at least to the year 2100.
Concerns About Rising Sea Level
We began sea level story by looking at past fluctuations of CO2 concentration in the Earth's atmosphere and average Earth temperature. We understand those factors that influence sea level. We see the relationship between CO2 concentration in the atmosphere, average global temperature, and climate. We see the compelling evidence for the rise of sea level after the last ice age 25,000 years ago and the recent accelerating rate at which sea level is rising since the start of the Industrial Revolution in 1750 to 1850. We have answered one important question "is sea level really rising". The answer is yes.
Because sea level is rising, it is reasonable to conclude that people who live close to the ocean should be concerned. Virtually all scientists and most of the world's informed political leaders are concerned about rising sea level. They are watching, anticipating, and even attempting to mitigate what climate change and rising sea levels might do to their countries and to the global community. They understand that climate change and rising sea levels comes from increasing CO2 concentration in the atmosphere. They understand the link between human activities and very recent CO2 concentration in the atmosphere. They understand that climate change and rising sea levels have the potential to:
flood land;
contaminate fresh groundwater and surface water resources with salt water;
disrupt and destroy the land and marine environments, ecosystems, and food sources in ways that we are just starting to understand;
flood and destroy coastal cities and island countries;
create millions of climate change refugees; and
disrupt social, economic and political systems as we know them.
Many coastal communities around the world are already experiencing flooding that is the result of rising sea level. The flooding in Miami Beach, south Florida, United States, provides one example of costly engineering projects required to protect a coastal city from rising sea levels. These reactive engineering projects cost a lot of money - about $400 to 500 million to Miami Beach alone.
Summary
Global Mean Sea Level (GMSL) changes when the volumes of the Earth's oceans change;
The ocean volumes are influenced by changes to average global temperature and global climate;
Increasing CO2 (and other greenhouse gases, like methane) in the Earth's atmosphere warms the Earth's atmosphere, increases the average global temperature, warms the Earth's climate, causes land-based glaciers to melt, causes the thermal expansion of ocean water, and causes sea level to rise;
Decreasing CO2 (and other greenhouse gases, like methane) in the Earth's atmosphere has the opposite affect;
Starting at the end of the last ice age, about 20,000 years ago, sea level rose by about 120 meters (393 feet) due to warming climate, melting of land-based glaciers, and thermal expansion of warm oceans;
Following that dramatic rise in GMSL, there was a period of stable sea level for about 3,000 years;
About 250 years ago, sea level started to rise again following the beginning of the Industrial Revolution;
The rate at which sea level is rising jumped to about 3.4 mm per year in very recent history - faster than the rate at which sea level rose in the previous 3,000 years;
This jump in the rate of rising sea level corresponds to a dramatic 45% increase in CO2 concentration in the Earth's atmosphere since the start of the Industrial Revolution, to over 400 ppm, a concentration that is higher than at any time in the last 800,000 years;
The dramatic 45% increase in CO2 concentration in the Earth's atmosphere is attributed to the burning, by humans, of fossil fuels, like peat, coal, oil and natural gas, which released a lot of waste CO2 into the atmosphere;
Predictions to the year 2100 suggest that sea level will continue to rise at a minimum rate of 3.4 to 3.7 mm per year and may rise at a rate of 30.5 mm per year, which equates to a minimum GMSL rise of about 0.3 metre (300 mm or about 1 foot) or a more dire GMSL rise of about of about 2.5 meters (8.2 feet) by the year 2100;
Rising sea level no joke! It is supported by observations, measurements, and sound science. The very recent rise in sea level is related to human activities, such as burning of fossil fuels. Rising sea level is one of the impacts of climate change. Rising sea levels have the potential to inflict huge social, economic, and political costs and turmoil on all countries in ways that we cannot fully anticipate.
Now, we are now almost ready to address the question "will rising sea level affect the near-coastal communities along Hudson Bay and James Bay, Ontario" in a future post.