
Ontario: Rising Sea Levels Chapter 2 - Impact Of Rising Sea Level On Coastal Communities Along Hudson and James Bays

This image shows raised beaches (black horizontal lines) that formed when the land started to rise at the end of the ice age. The raised beaches mark the location of the former shoreline with the ancient Tyrrell Sea. Two other features are present in the photo: a) the present day shoreline with Hudson Bay occurs as the ice-covered, white area at the bottom of the photo; and b) a modern river snakes across the landscape and cuts the raised beaches. Photo by Andy Fyon, northeast of Fort Severn, March 31, 2012.
Sea Levels Are Rising Globally
In Chapter 1 of this topic on rising sea levels entitled Rising Sea Levels: Chapter 1 - Cause And Evidence, I outlined the evidence showing us that sea levels have changed throughout the history of the Earth. In that Chapter, I summarized the geological and other evidence for the:
historical changes in sea levels through geological time;
increasing rate of rising sea level since the Industrial Revolution;
relationship between human activity of burning carbon-based fossil fuels, the increasing CO2 concentration and other greenhouse gases in the Earth's atmosphere, the recent increase in the global mean temperature of the Earth, the warming and changing of the Earth's climate, and rising sea levels.
In this Chapter 2, we ask if rising sea level presents a flooding threat to the near-coastal communities along Hudson Bay and James Bay, Ontario.
Review: Rate Of Rising Sea Level
Observations, measurements, and sound science, such as a recent report by the National Oceanic and Atmospheric Administration, which examines the impacts of sea level change on the United States, show us that modern sea level is rising at a rate of about 3.4 mm per year. Estimates suggest that sea level will continue to rise at a minimum rate of 3.3 to 3.7 mm per year. That translates to a minimum rise of global mean sea level (GMSL) of about 0.3 metre (300 mm or about 1 foot) by the year 2100. In the worst case, some estimates suggest that GMSL will rise at a rate of 30.5 mm/year, which translates to an estimated worst case rise of GMSL of about 2.5 metres (2500 mm or about 8.2 feet) by the year 2100.
Comprehensive studies on the northern community of Tuktoyaktuk, Northwest Territories, illustrates the threat to sea shore communities due to rising sea levels. Given these rates of rising sea levels, is there a similar threat that the ocean will flood the near-coastal, Ontario communities of Fort Severn, Peawanuck, Attawapiskat, Kashechewan, Fort Albany, and Moosonee, all of which lie within the Hudson Bay and James bay lowlands (Figure 1)?
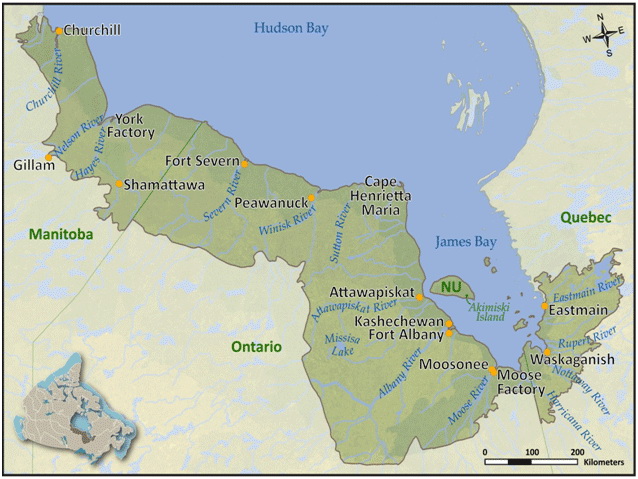
Figure 1: Location of the near-coastal, Ontario communities of Fort Severn, Peawanuck, Attawapiskat, Kashechewan, Fort Albany, and Moosonee. Communities in Manitoba and Quebec are not considered in this discussion of rising seal level. Image from: http://www.biodivcanada.ca/default.asp?lang=En&n=36A1BD46-1&printfullpage=true
A Simple Flood Risk Assessment
In this Chapter, I carry out a very simple analysis and consider only the potential flooding of the communities by the rising sea level. For example, in the most simple case, if we keep the elevation of a piece of land, such as an island, fixed at 1 meter above the present sea level, and cause the level of the sea to rise by 1.5 meters, eventually the sea will flood the land and cover the island by 0.5 meter of water. That is the type of analysis I examine in this post. I will not consider the impacts of local currents, tides, or storm surges. These factors are very important, but are beyond the scope of this analysis.
I will carry out the analysis for the year 2100, which is as far into the future that sea level estimates have been made by the expert science community. That is about 82 years from now (depending when you read this - written spring 2018).
Rising Land: Isostatic Adjustment
When thinking about flooding of land along the coasts of Hudson Bay and James Bay, there is one important geological factor that also must be considered: isostatic rebound, also known as isostatic adjustment. In northern Ontario, the south shore of Hudson Bay between Fort Severn, Peawanuck, and Cape Henrietta Maria, and the western shore of James Bay is rising. Part of the evidence for rising land in the lowlands are the many old beaches that occur tens of kilometers inland from the present coastline (Figure 2).
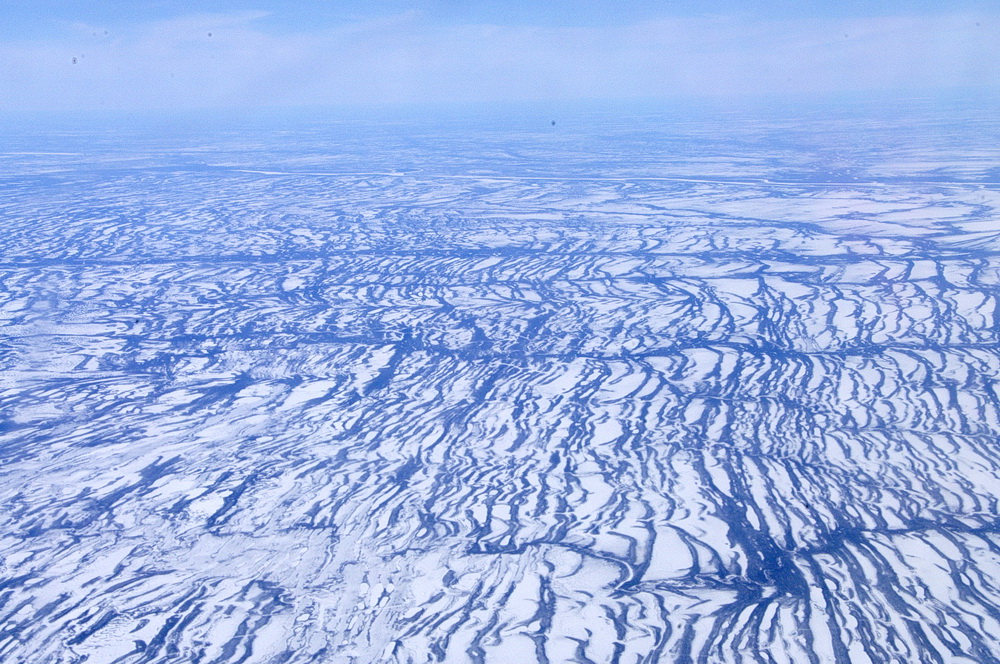
Figure 2: The dark lines that run from top to bottom of this photo are old beaches that occur up to 100 km south of the present shoreline of Hudson Bay. These old beaches mark the positions of the former shoreline of Hudson Bay over hundreds to thousands of years. The old shoreline beaches formed at the end of the last ice age when the land started to rise as the glacier melted, the weight of glacial ice was removed, and an ocean that flooded the land, called the Tyrrell Sea, drained back into Hudson and James bays over the past 8,000 years. Photo by Andy Fyon, east of Fort Severn, March 31, 2012.
These "raised beaches" formed after the last ice age ended. During the peak of the last ice age, about 25,000 years ago, the weight of glacial ice, which was 2 to 3 kilometer thick, pressed the surface of the Earth down into a bowl shape. When the glacial ice began to melt at the end of the ice age, an ocean called the Tyrrell Sea flooded the land. With the weight of glacial ice removed, the land also started to rise. This uplift slowly caused the Tyrrell Sea to drain northward into the ancestral Hudson and James bays. As the Tyrrell Sea drained northward, it left these old shoreline beaches that are called "raised beaches" or "stranded beaches" (Figure 2). These "raised beaches" are an excellent visual testament that the land was uplifted, and the Tyrrell Sea drained northward, after the ice age ended. This is called isostatic rebound. The land is still rising today!
When we ask if the rise of modern sea level will flood the land, we must consider the race between the rising land and the rising sea level. Which will win that race?
How Fast Is The Land Rising?
The land along the southern coast of Hudson Bay coast, between Fort Severn, Peawanuck, and Cape Henrietta Maria, is rising at a rate of about 1 metre to 1.3 metres (3.3 feet to 4.3 feet) per 100 years (Figure 3). Farther south along James Bay, towards Moosonee, the land is rising at a rate of about 8.5 mm per year, or about 0.85 meters (2.8 feet) per hundred years (Figure 3).
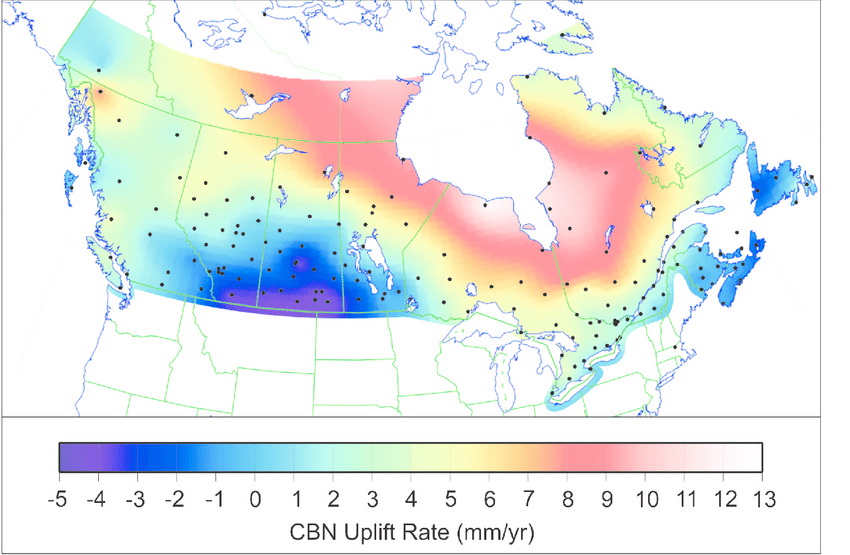
Figure 3: This image shows the rate at which the land is rising in response to isostatic adjustment. The red to pinky-white coloured areas along the southern coast of Hudson Bay, at Cape Henrietta is the fastest rising area in Ontario at a rate of about 13 millimeters per year or about 1.3 meters per hundred years. The land around Moosonee is rising at a rate of about 8.5 millimeters per year, or about 0.85 meters per hundred years. Image from: Crustal motion and deformation monitoring of the Canadian landmass
Uplifted Land And Rising Sea Level: Which Wins The Race
To calculate if the rising sea level will flood the coastal communities, we need to calculate if the rate of rising land will outpace the rate of rising sea level. To do that calculation, we need to know: a) the present elevation each community above today's sea level; b) the rate at which the land is rising; c) the elevation of each community in the year 2100 due to isostatic uplift; d) the rate that sea level is rising; and e) the estimated sea level in the year 2100.
Height Of Community Above Present Sea Level
As an estimate of the present elevation of each community (Fort Severn, Peawanuck, Attawapiskat, Kashechewan, Fort Albany, and Moosonee), I use the present elevations of the airports located in each community:
Fort Severn: airport located 16 m (52 feet) above present sea level
Peawanuck: airport located 52 m (173 feet) above present sea level
Attawapiskat: airport located 9 m (30 feet) above present sea level
Kashechewan: airport located 11 m (35 feet) above present sea level
Fort Albany: airport located 14 m (47 feet) above present sea level
Moosonee: airport located 9 m (30 feet) above present sea level
Height Of Community In Year 2100 Due To Isostatic Uplift
The elevation of each community in the year 2100 is calculated as follows: a) multiply the time (82 years from today, 2018) times the rate of isostatic uplift; then b) add that amount to the present elevation. For this calculation, I do not need to consider any rise in sea level. I assume a uniform rate of isostatic uplift between today and the year 2100.
Fort Severn: (82 x 0.01 m/year) + 16 m = 16.82 m elevation reached by the year 2100
Peawanuck: (82 x 0.012 m/year) + 52 m = 52.98 m elevation reached by the year 2100
Attawapiskat: (82 x 0.009 m/year) + 9 m = 9.74 m elevation reached by the year 2100
Kashechewan: (82 x 0.0085 m/year) + 11 m = 11.70 m elevation reached by the year 2100
Fort Albany: (82 x 0.0085 m/year) + 14 m = 14.70 m elevation reached by the year 2100
Moosonee: (82 x 0.008 m/year) + 9 m = 9.66 m elevation reached by the year 2100
The simplest way to understand these numbers is to consider Peawanuck. In 82 years, the Peawanuck airport land would have been uplifted by about 1 metre. So, assuming there was no rise in sea level, in 2100, the Peawanuck airport would lie at 52.98 meters elevation because of isostatic uplift, versus the present-day elevation of 52 metres.
To understand if rising sea levels will flood the land, we need to consider the rate at which sea level is rising and therefore, the elevation of the surface of the ocean in the year 2100. That is our next calculation.
How Much Will Sea Level Rise By Year 2100
I use two figures for the rate of sea level rise, based on the most recent estimates included in the report released by the National Oceanic and Atmospheric Administration, which examines the impacts of sea level change on the United States:
sea level will continue to rise at a minimum rate of 3.3 to 3.7 mm per year, which translates to a minimum rise of GMSL of about 0.3 metre (300 mm or about 1 foot) by the year 2100 - I call this the conservative sea level rise by the year 2100;
in the worst case, GMSL will rise at a rate of 30.5 mm per year, which translates to a worst case rise of GMSL of about 2.5 metre (2500 mm or about 8.2 feet) by the year 2100 - I call this the extreme sea level rise by the year 2100.
The Difference Between Uplifted Land Surface And Sea Level Rise In Year 2100
To calculate if the rising sea level will cause the ocean to flood the land in year 2100, we need to subtract the future elevation of the new sea level in year 2100, after sea level rise, from the future land height after uplift between year 2018 and year 2100. If we end up with a positive value, we know that the land is still higher that the sea level in year 2100 and flooding will not occur.
Fort Severn:
Conservation estimate: 16.82 m (land elevation by the year 2100) - 0.3 m (sea level rise by year 2100) = 16.5 m
Extreme estimate: 16.82 m (land elevation by the year 2100) - 2.5 m (sea level rise by year 2100) = 14.3 m
Peawanuck:
Conservative estimate: 52.98 m (land elevation by the year 2100) - 0.3 m (sea level rise by year 2100) = 52.6 m
Extreme estimate: 52.98 m (land elevation by the year 2100) - 2.5 m (sea level rise by year 2100) = 50.4 m
Attawapiskat:
Conservative estimate: 9.74 m (land elevation by the year 2100) - 0.3 m (sea level rise by year 2100) = 9.44 m
Extreme estimate: 9.74 m (land elevation by the year 2100) - 2.5 m (sea level rise by year 2100) = 7.2 m
Kashechewan:
Conservative estimate: 11.70 m (land elevation by the year 2100) - 0.3 m (sea level rise by year 2100) = 11.4 m
Extreme estimate: 11.70 m (land elevation by the year 2100) - 2.5 m (sea level rise by year 2100) = 9.2 m
Fort Albany:
Conservative estimate: 14.70 m (land elevation by the year 2100) - 0.3 m (sea level rise by year 2100) = 14.4 m
Extreme estimate: 14.70 m (land elevation by the year 2100) - 2.5 m (sea level rise by year 2100) = 12.2 m
Moosonee:
Conservative estimate: 9.66 m (land elevation by the year 2100) - 0.3 m (sea level rise by year 2100) = 9.36 m
Extreme estimate: 9.66 m (land elevation by the year 2100) - 2.5 m (sea level rise by year 2100) = 7.19 m
We see from this simple calculation that in the year 2100, assuming constant isostatic uplift and using the conservative and extreme estimates for the rate of sea level rise, all the airports will still be several metres above the estimated future level of the sea. That means the coastal communities are not predicted to be flooded out by the year 2100, using this simple model.
Cautions
I made many assumptions to arrive at the cautious conclusion that the coastal communities of Fort Severn, Peawanuck, Attawapiskat, Kashechewan, Fort Albany, and Moosonee will not be flooded by sea level rise up to the year 2100.
Recall, I assumed:
constant rate of isostatic uplift of the land between now and year 2100;
a conservative and constant rate of sea level rise of 3.3 to 3.7 mm per year (about 300 mm or 1 foot sea level rise by year 2100);
an extreme constant rate of sea level rise of 30.5 mm per year (about 2500 mm or about 8.2 feet sea level rise by the year 2100);
I have not considered the impacts of storm surges, king tides, and local currents; and
I have not considered the impact of melting permafrost on the shape of the land.
The estimated rate of sea level rise is subject to many more uncertainties. Scientists have noted that the rate at which sea level is rising abruptly accelerated recently. This change warns us that the models used to estimate the future rate of sea level rise is affected by factors that we don't fully understand. Two such factors could include: a) our poor understanding of the way Greenland and Antarctic land-based ice sheets melt; and b) run-away melting of the land-based ice sheets in response to run-away warming of the Earth's atmosphere, perhaps because of catastrophic, unexpected carbon dioxide and methane release from melting permafrost areas.
Conclusion
The airport lands of the coastal communities of Fort Severn, Peawanuck, Attawapiskat, Kashechewan, Fort Albany, and Moosonee are not likely to be flooded by sea level rise up to the year 2100, based on very simple calculations using estimates of the rate of land uplift due to isostatic adjustment and estimates of the rate that sea level rise between now and the year 2100. Lower elevation lands in, and near, the communities may well flood. Catastrophic sea-level rise due to run-away melting of land based ice sheet on Greenland and Antarctica does represent the "elephant in the room" and if that happens, none of these simple calculations are valid.